14 Student responded to the question.
14 Student responded to the question.
14 Student responded to the question.
14 Student responded to the question.
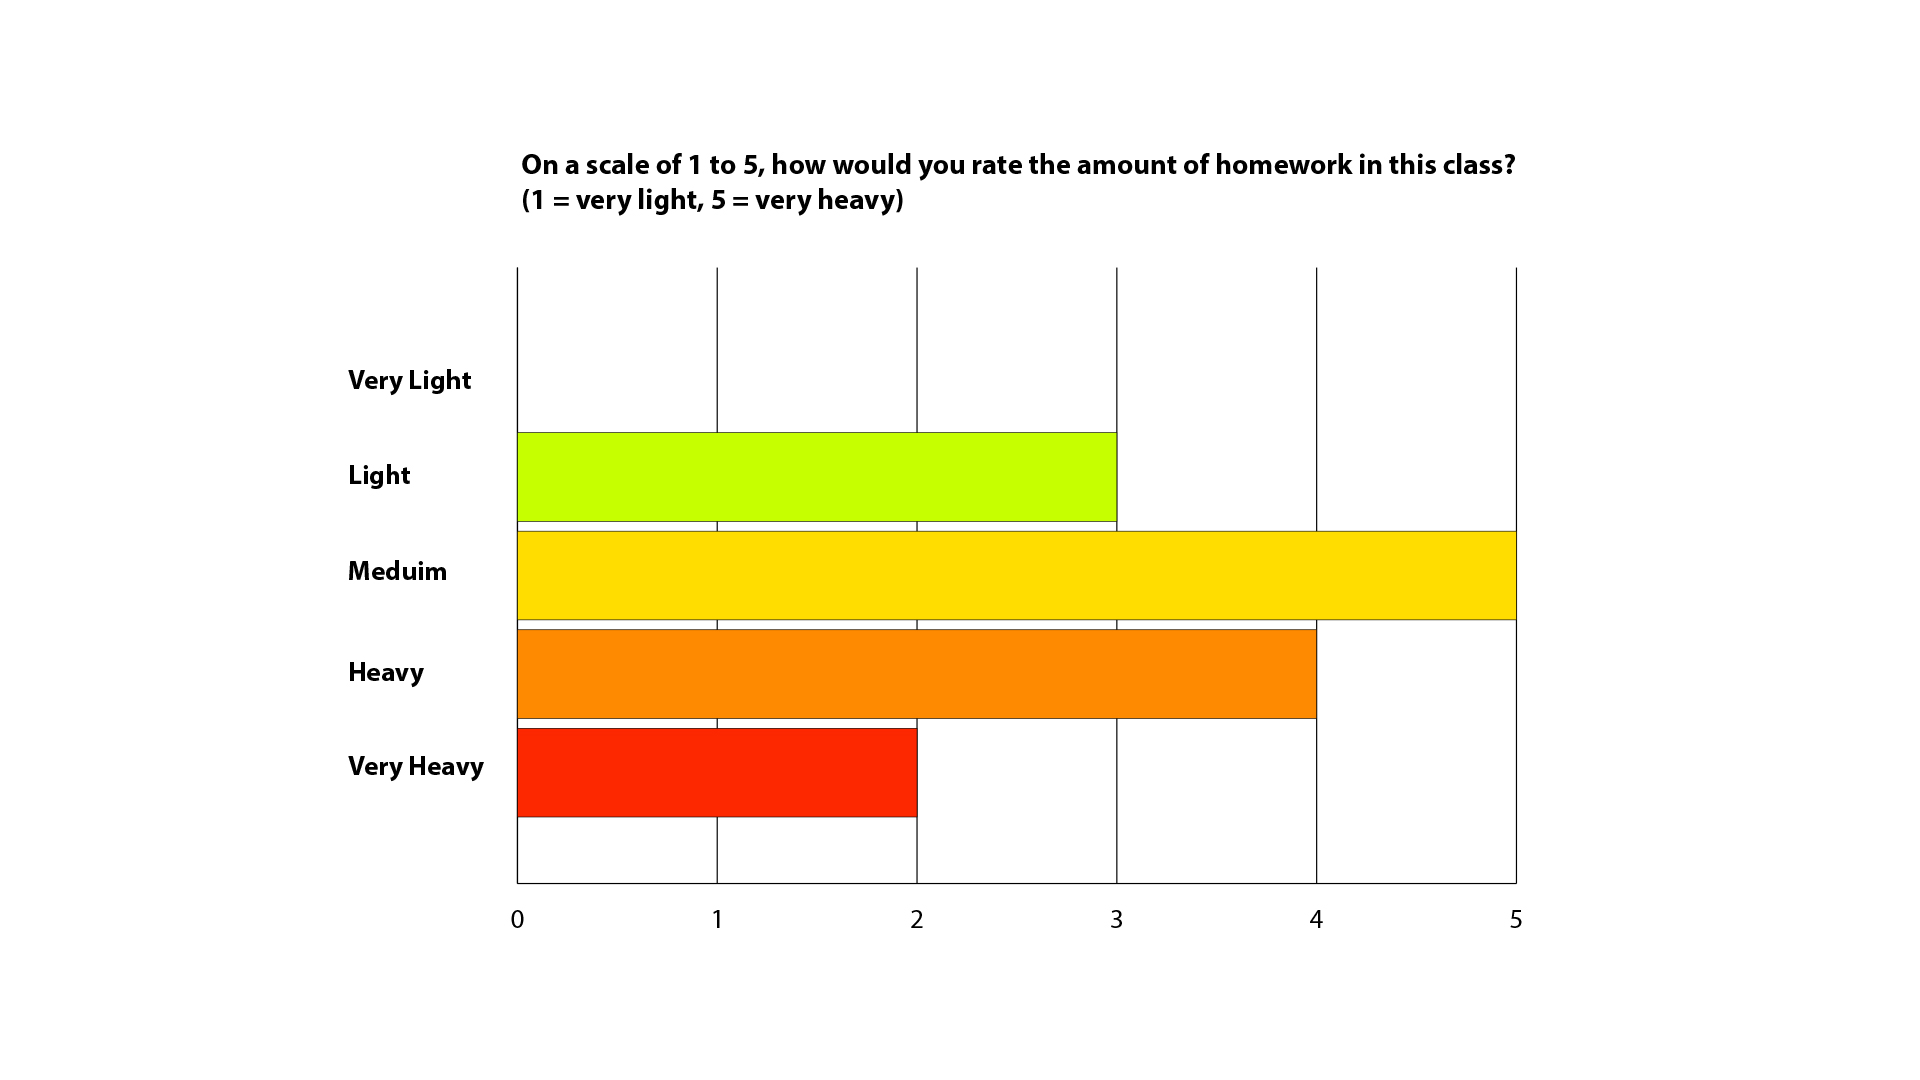
Based on the instructions, I created a form and asked other students in MEDPL150 WhatsApp channel for their opinions about the class. After a few days, only 14 people responded. This number isn’t enough to fully understand everyone’s views, but the results are still interesting.
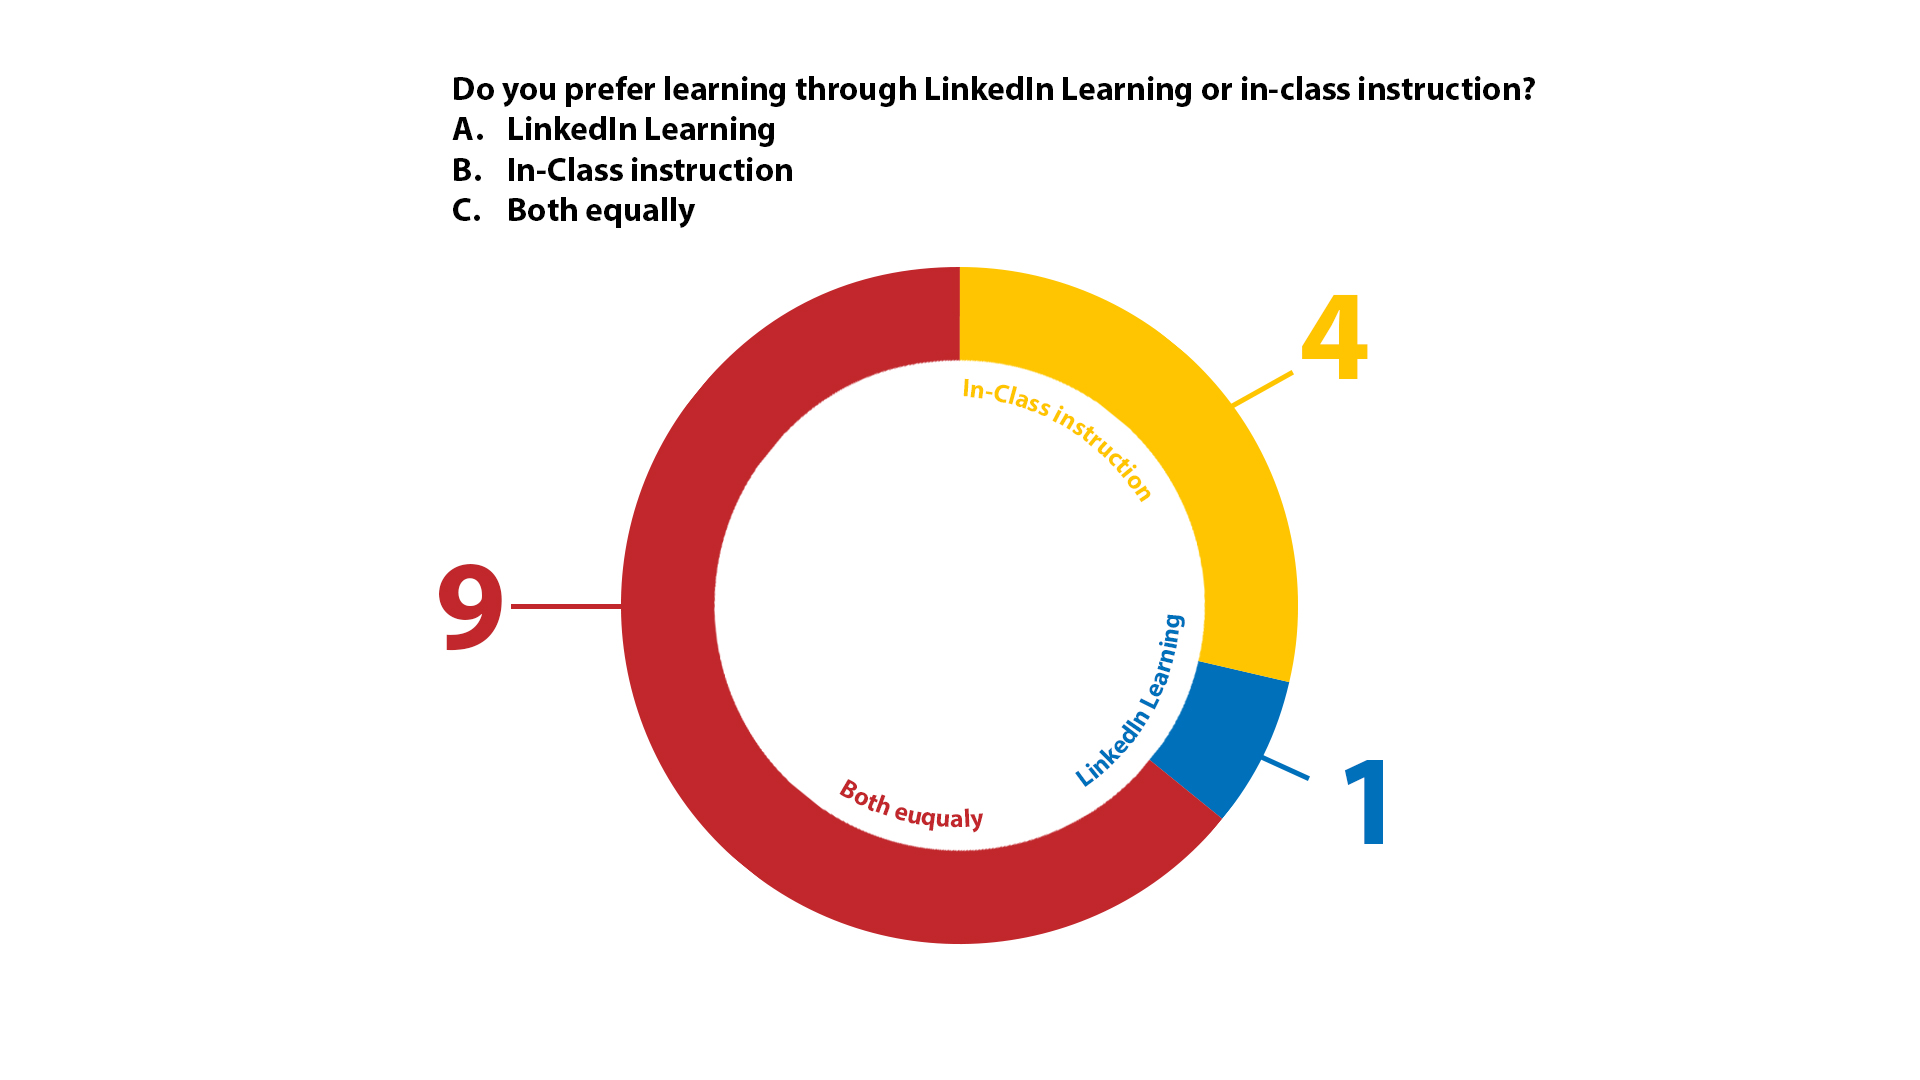
The responses were a bit different from my own opinions. For example, when I asked whether students prefer learning through LinkedIn Learning or in-class instruction, one person preferred LinkedIn, and four people liked both equally, which was surprising. I was thinking it is less likely that anyone choses those two answers.
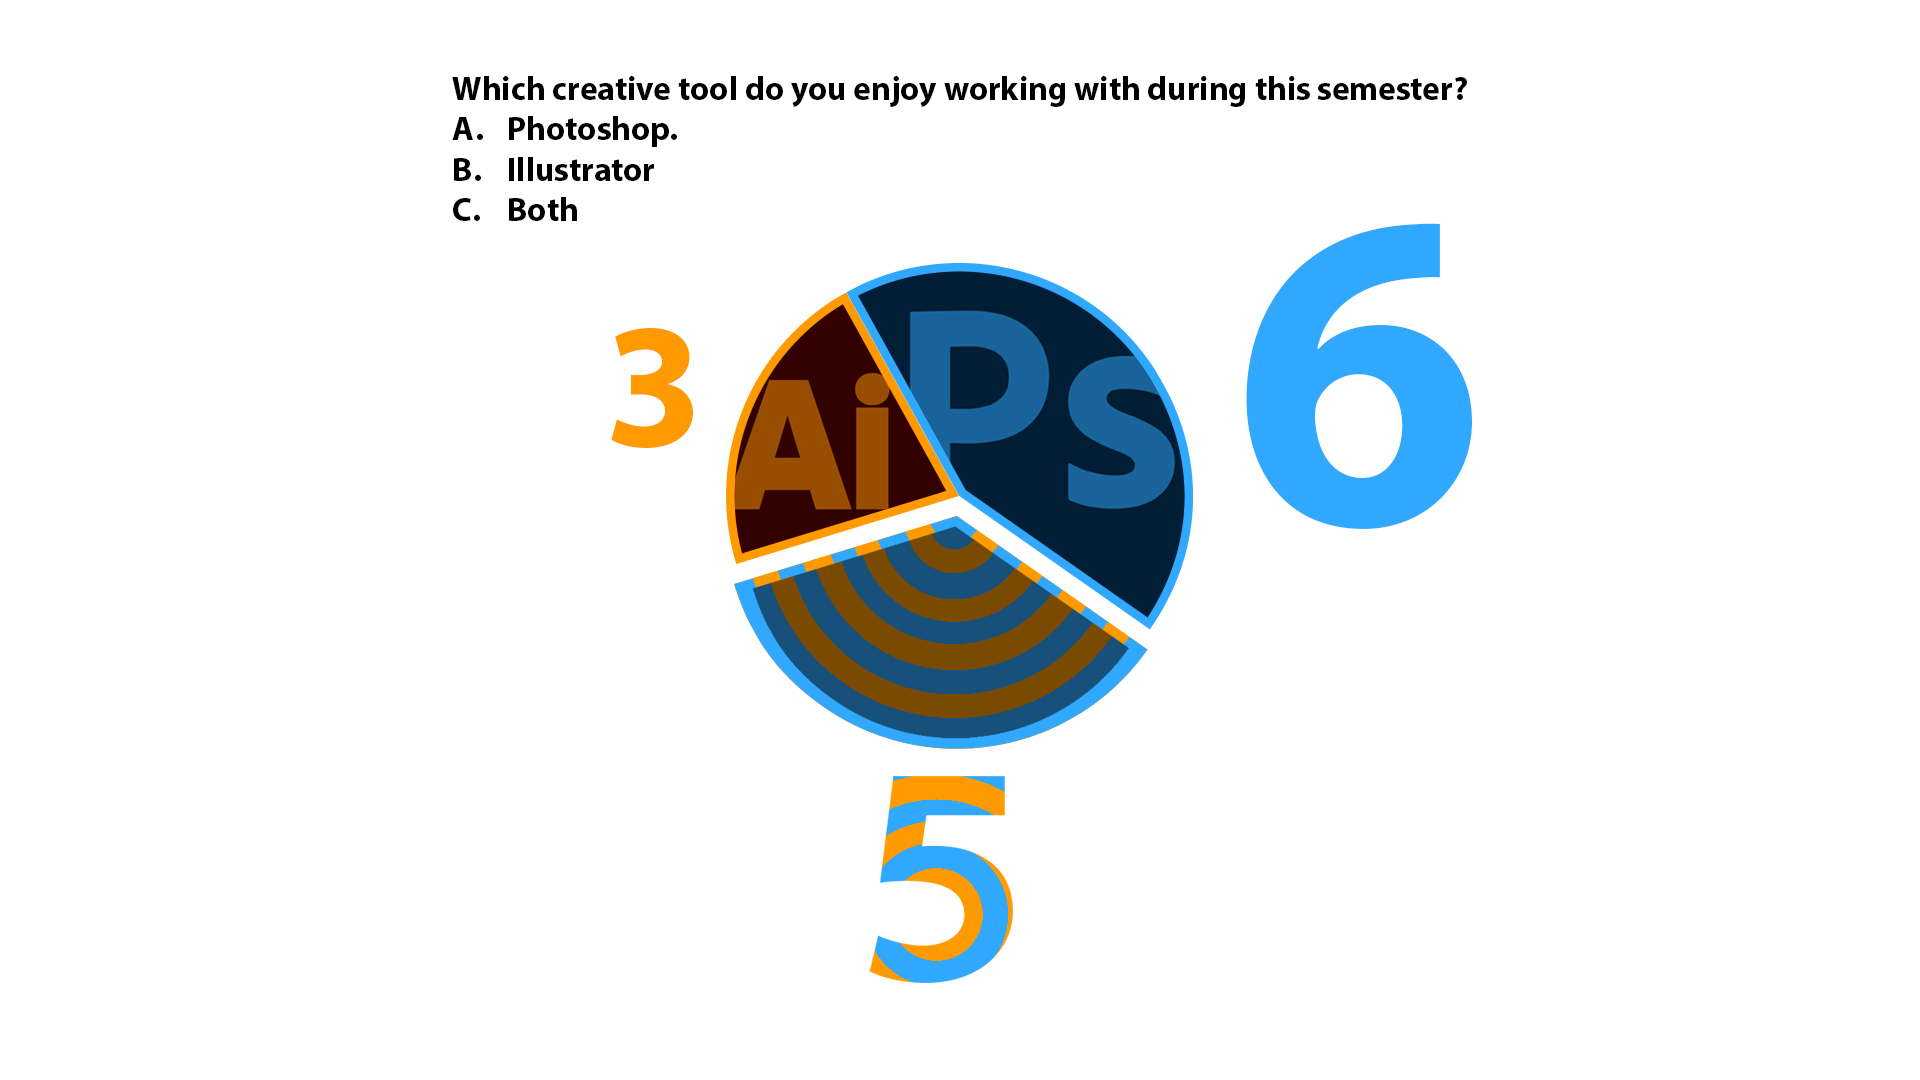
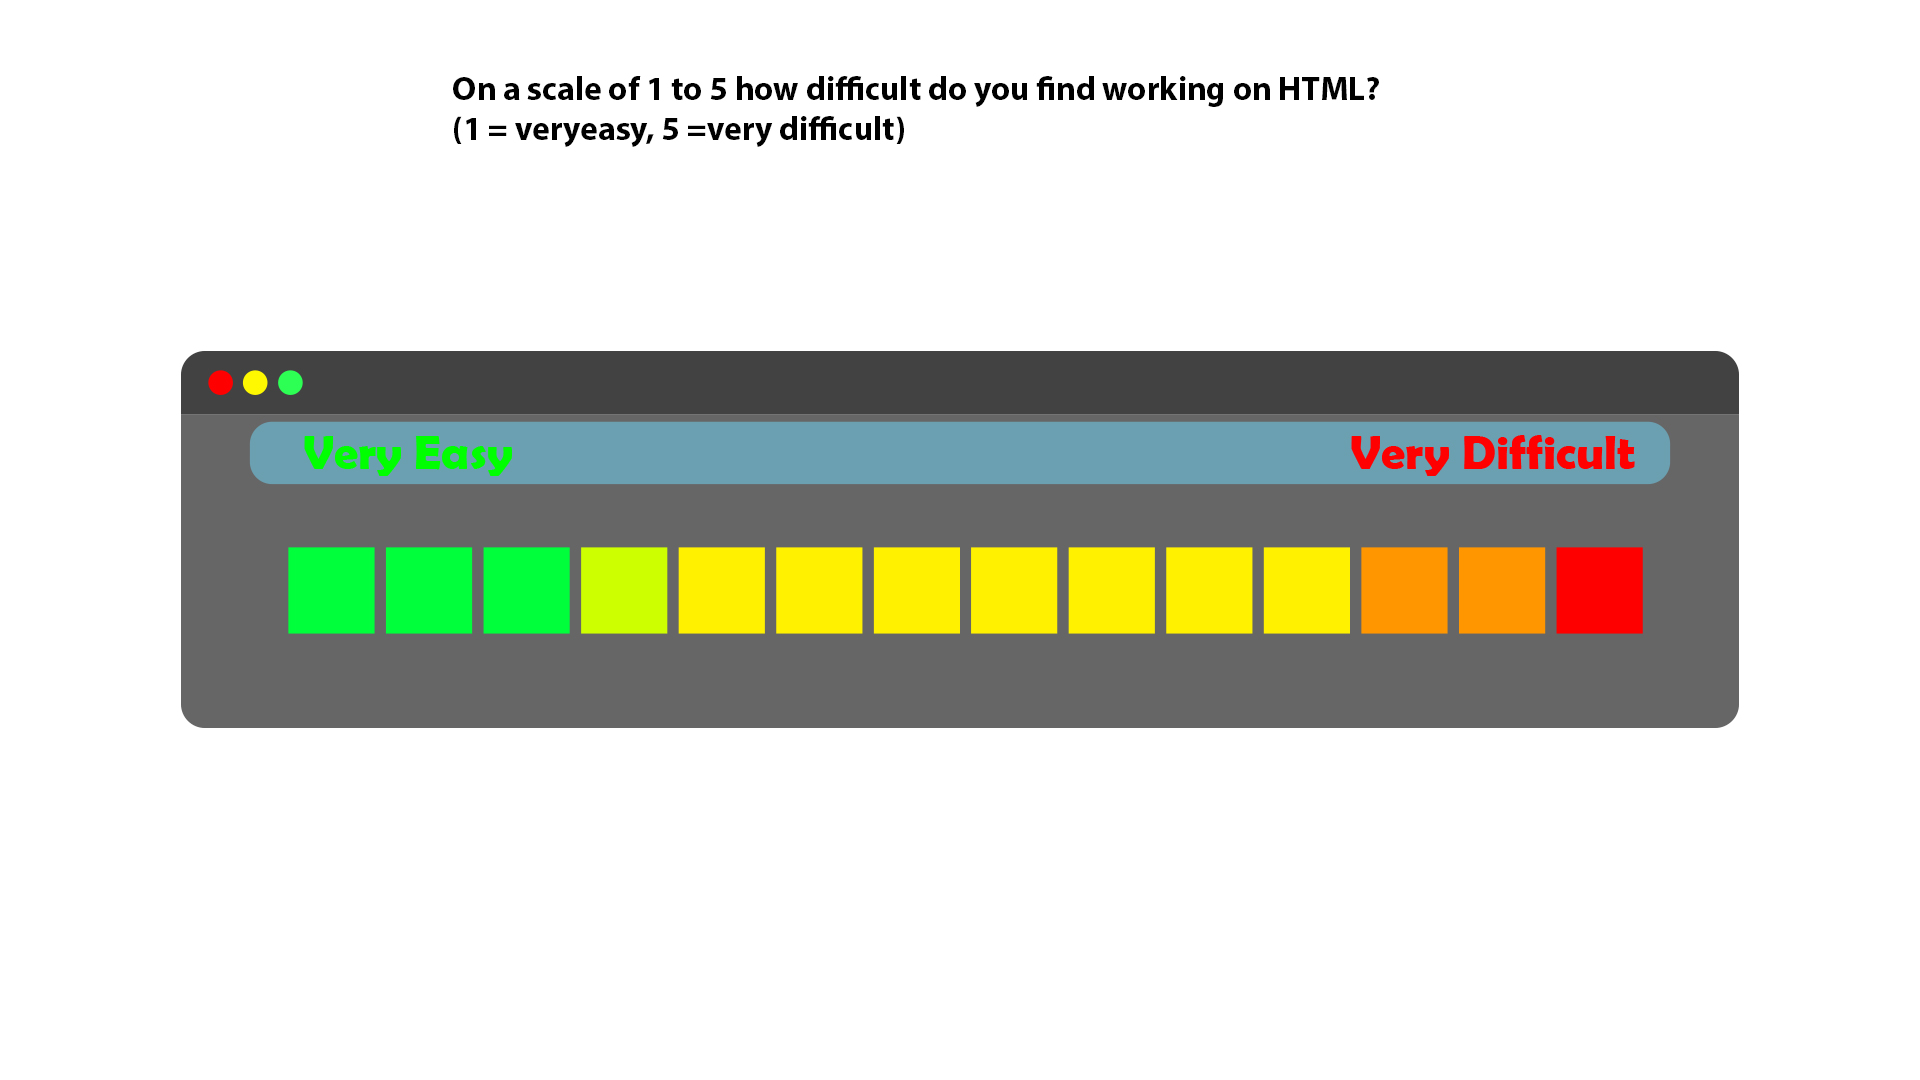
I also tried to make the questions easier so I could design better graphics. The design process was challenging because I wanted each question to have a unique look and I am not an efficient designer using Illustrator. Just want to highlight that the 4th image was not created using graph tools. I designed it in a simpler way to show the result. Ultimately, if I could design the graphs in Photoshop, the results would look much better.